 The Optus cyber attack that impacted the data of over 9.7 million Optus subscribers has been a huge wake-up call for many Australian businesses and consumers. The sheer volume of data stolen from such a major organisation, with enterprise-grade security, raises questions as to how any organisation or individual can protect themselves.
From brand damage to financial compensation and possible legal penalties, the fallout of a cyber attack can be immense. Not to mention that attacks are on the rise, skyrocketing in 2020 as the world moves online to cope with COVID. The FBI reported a 300% increase in cybercrime since the pandemic, with a 238% rise in cyber attacks on financial institutions.
According to the Australian Cyber Security Centre’s (ACSC) second annual report in 2021, ACSC saw a 13% increase in cybercrime in Australia from 2020 to 2021. ACSC recorded 67,500 reports of cybercrime in the period up to July 2021 compared to 59,806 reports of cybercrime in the period up to July 2020. It’s no longer a matter of if a cyber attack occurs, but when.
Clearly old security methods are no longer up to the task. The asymmetry of defence vs attacks is a particular problem. Organisations have myriad sites to defend and potential vulnerabilities, with numerous ways of being attacked.
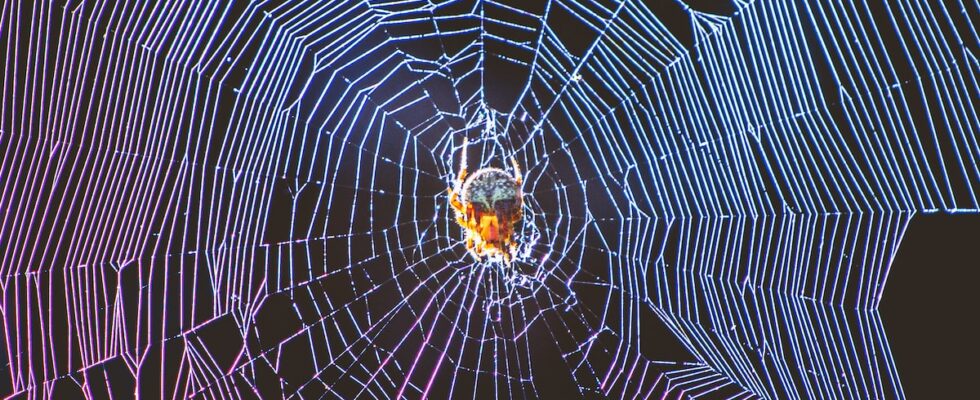
A new approach: graphs for cybersecurity
Security professionals have traditionally relied on lists to defend against attacks, using logs and alerts from software tools. It’s very manual, intensive work with an overabundance of data. The average large organisation has 75 different security tools deployed with every one of them generating logs and alerts. These sheer numbers present a big challenge for an organisation’s security team, often forcing security analysts to rely on “gut feeling” rather than investigating each anomaly.
Part of the problem is the way data is traditionally stored in databases. Tables and spreadsheets are good for collecting and processing data, but they miss relationships between data points and don’t do an effective job of representing the complexity of modern IT infrastructure. As a result, it’s impossible to get a holistic view, which creates blind spots.
Cyber criminals view a network like a graph, often believing that they only need to access one node where they can quickly exploit a weakness and build towards the most valuable systems and data.
To counter this, defenders need to think likewise. By building a complete graph of their infrastructure, updated over time, they can create a digital twin. A knowledge graph can capture the complexity of modern IT environments, representing intricate networks of entities and the relationships between them. This helps uncover suspicious patterns that are otherwise hard to detect. Defenders need to ask questions — which systems connect to which systems? Which systems are open to the internet? What permissions do different users have? What are the ‘crown jewel’ systems and the highest priority to protect?
The advantages of graph-based security
1. A more proactive approach
Through a graph, security professionals can spot potentially suspicious connections and activity at an early stage, enabling a more preventative and proactive approach. For example, a security team may want to monitor how many attempts an IP address has made to log into a system or systems or how many logins are coming from a country people do not normally log in from. By having a graph that shows accounts and the IPs logged into them, patterns become easier to identify.
2. Visualising vulnerabilities
Attack paths along a knowledge graph take the attackers’ perspective and show the path of potential multistage attacks along with the vulnerabilities used at each stage. This process goes beyond a static list of vulnerabilities and looks at how an attacker could use them. Using a graph visualisation tool makes this much more intuitive.
3. Planning and preparation
A digital twin enables security teams to programmatically assess the impact of changes to the environment before implementing them. An approval gate to check changes is critical to protecting the system. Suspicious changes can be automatically rejected or rolled back, or reviewed manually, depending on what rules are implemented.
4. Detection and resolution
While it’s impossible to prevent all attacks, a graph-based representation of systems makes it much easier to ring-fence an attack if it occurs. Graph visualisations show the critical information needed to determine how to stop an attack — potentially by blocking user accounts or access from specific IP address ranges. Compromised assets can quickly be identified and isolated before attacks spread.
5. Continuous improvement
Over time, detecting intrusions becomes quicker and easier to control as more data is gathered. If attack fingerprints are picked up that have been seen before, it may mean a similar attack strategy is being followed, even by the same attacker. Future attacks can then be more easily mitigated.
The landscape of cybersecurity vulnerabilities, weaknesses and attack patterns is continually evolving. We’ve seen how traditional technologies are struggling to cope. However, a viable option for future fit security would be to look at using graph technology that could ultimately save organisations millions not only financially but reputationally.
By Peter Philipp, ANZ general manager at Neo4j
This article was first published by Technology Decisions